Anatomy of a Truckload Market Cycle
We’ve explained the basic market dynamics that drive the market cycle, let’s break one down, step-by-step.
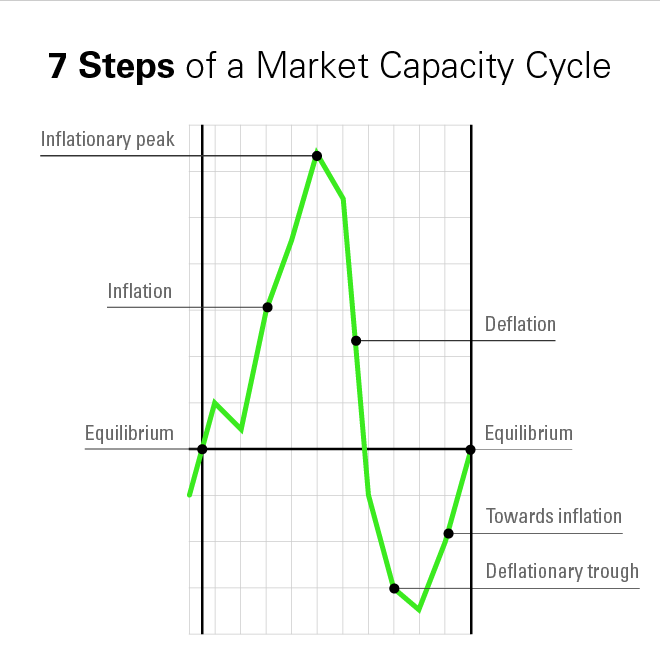
7 steps
- Market is at equilibrium: rates are stable, and capacity and demand are in balance.
- Market begins to inflate: There is more capacity than demand. Spot rates start rising and exceed contract rates as they reset to meet current market conditions. Capacity starts entering the market.
- Inflationary peak: Though primary tender acceptance rates are relatively low, and spot rates are high, enough capacity has flooded the market to pull the market downwards.
- Market begins to deflate: spot rates start falling, while contract rates continue rising for a few more quarters, influenced by the recent peak. Eventually, as spot rates keep dropping and contract rates dip downwards, capacity will start to exit the market.
- Deflationary trough: enough capacity has been pushed out of the market (relative to demand), and spot rates begin rising.
- Market begins to inflate (again): though the wider market won’t realize it in real time, the upward climb begins, setting up the next cycle.
- Market is back at equilibrium: a new cycle begins.
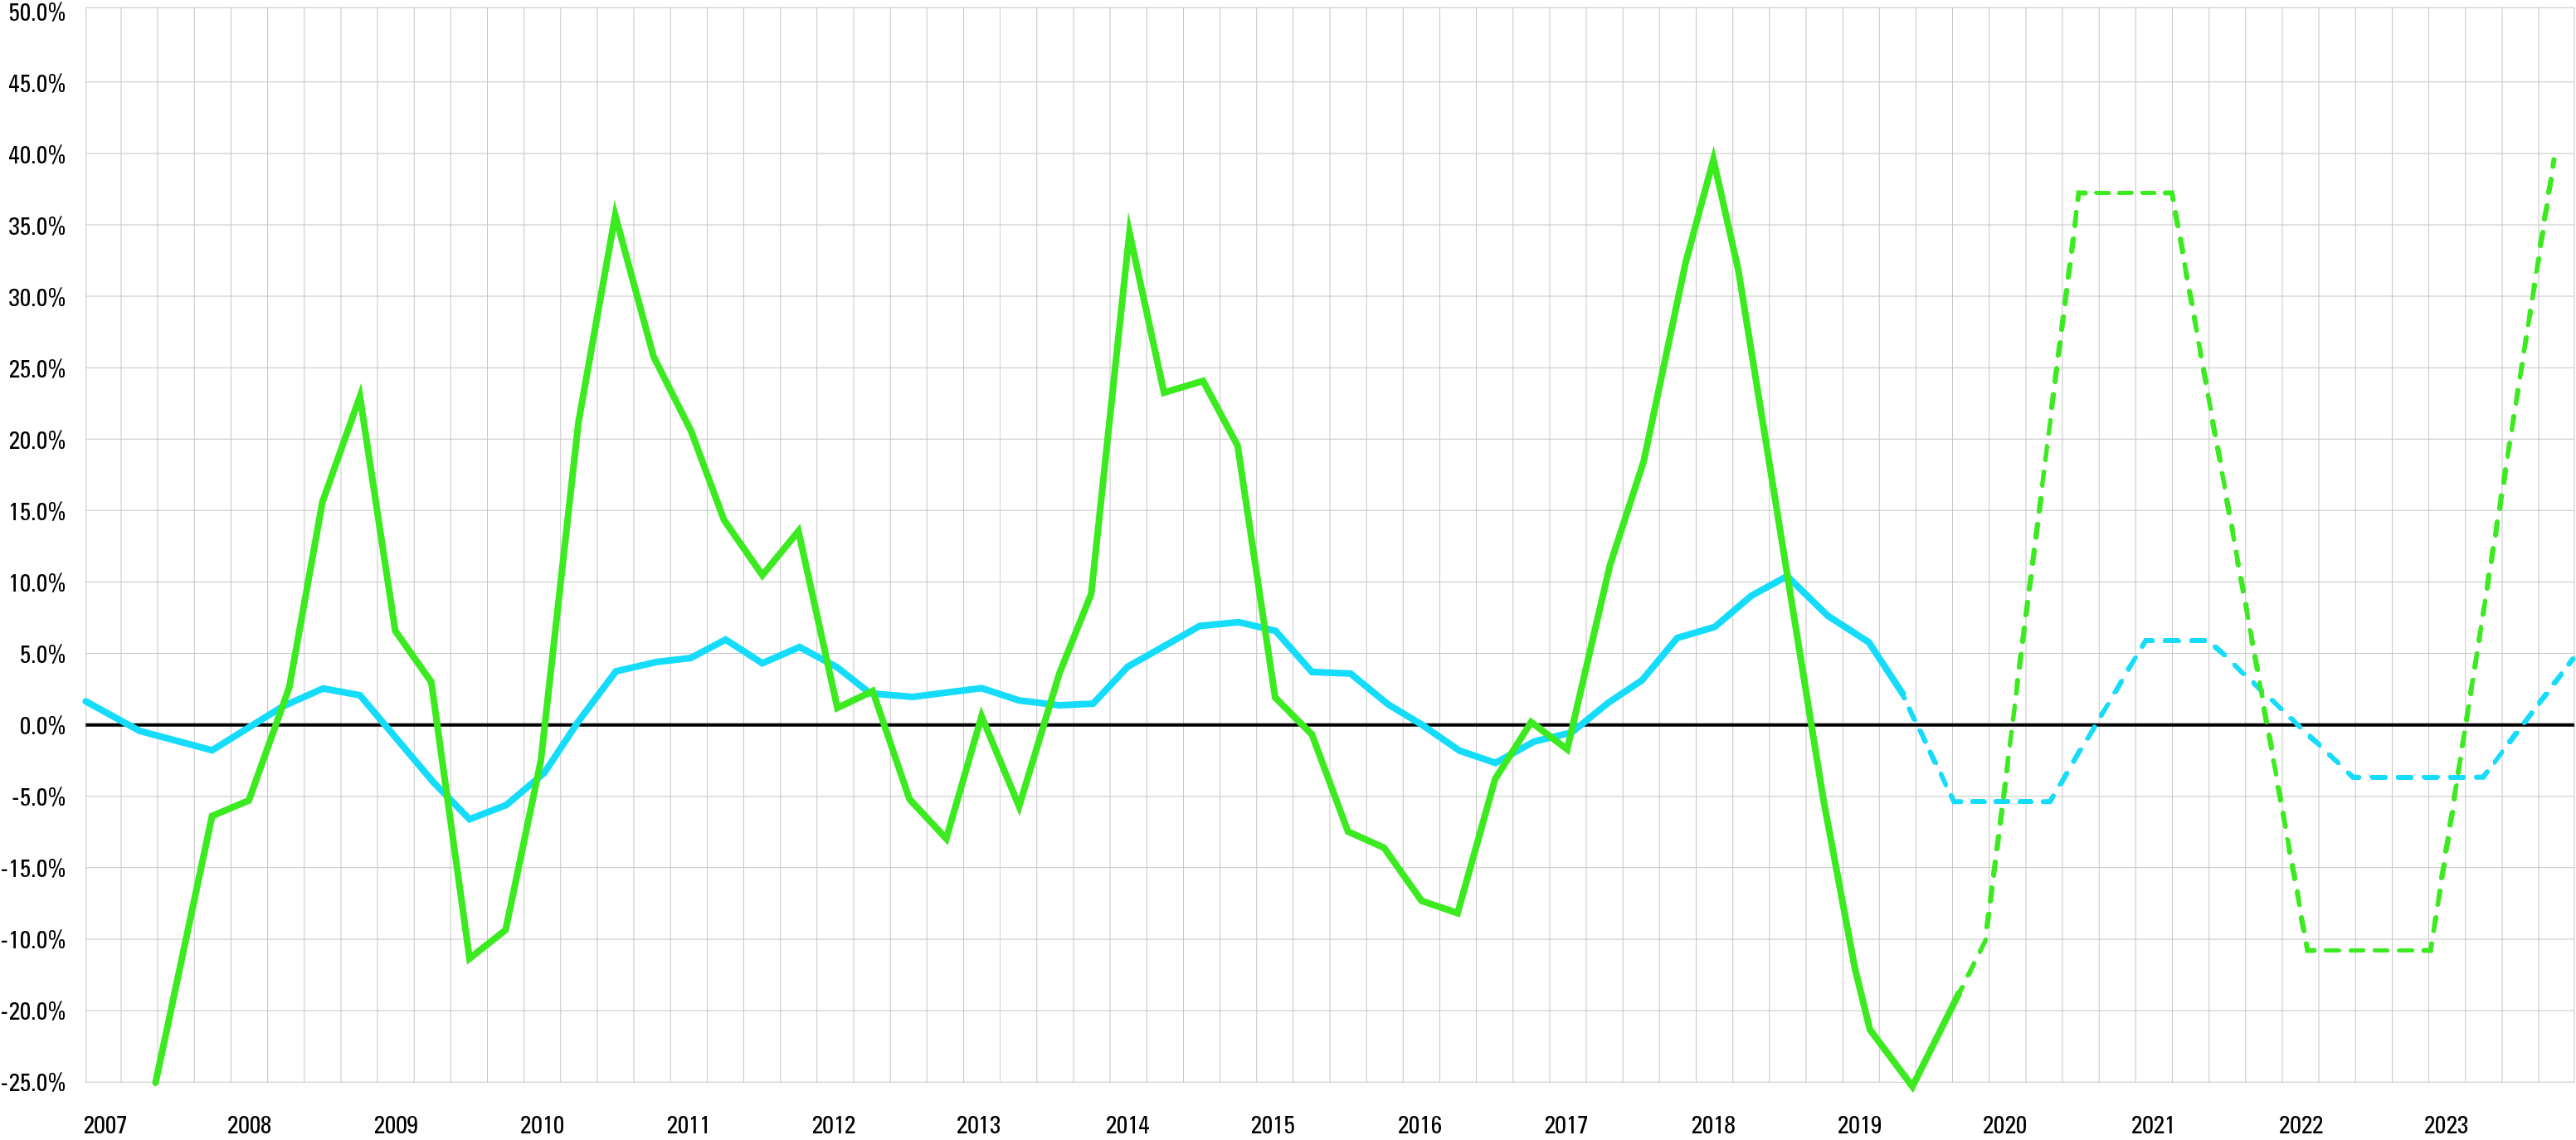
Measuring the Market Capacity Cycle
Understanding truckload market dynamics is one thing — accurately measuring it is another.
The blue line is an index that a broker, Coyote Logistics, uses to get a sense of how the freight market is. A lot of big brokers are now using data to get better at pricing both to shippers and carriers.